In probability theory and statistics, the exponential distribution or negative exponential distribution is the probability distribution of the time between events in a Poisson point process, i.e., a process in which events occur continuously and independently at a constant average rate. It is a particular case of the gamma distribution. It is the continuous analogue of the geometric distribution, and it has the key property of being memoryless. In addition to being used for the analysis of Poisson point processes it is found in various other contexts.
The exponential distribution is not the same as the class of exponential families of distributions. This is a large class of probability distributions that includes the exponential distribution as one of its members, but also includes many other distributions, like the normal, binomial, gamma, and Poisson distributions.
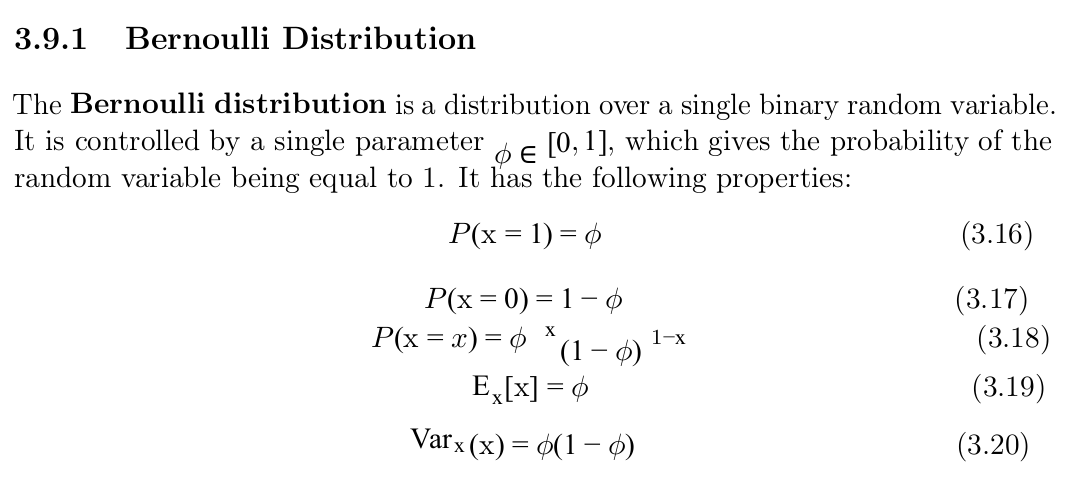
From the book: Ian Goodfellow, Yoshua Bengio, Aaron Courville - Deep Learning - The MIT Press (2016)